☁️
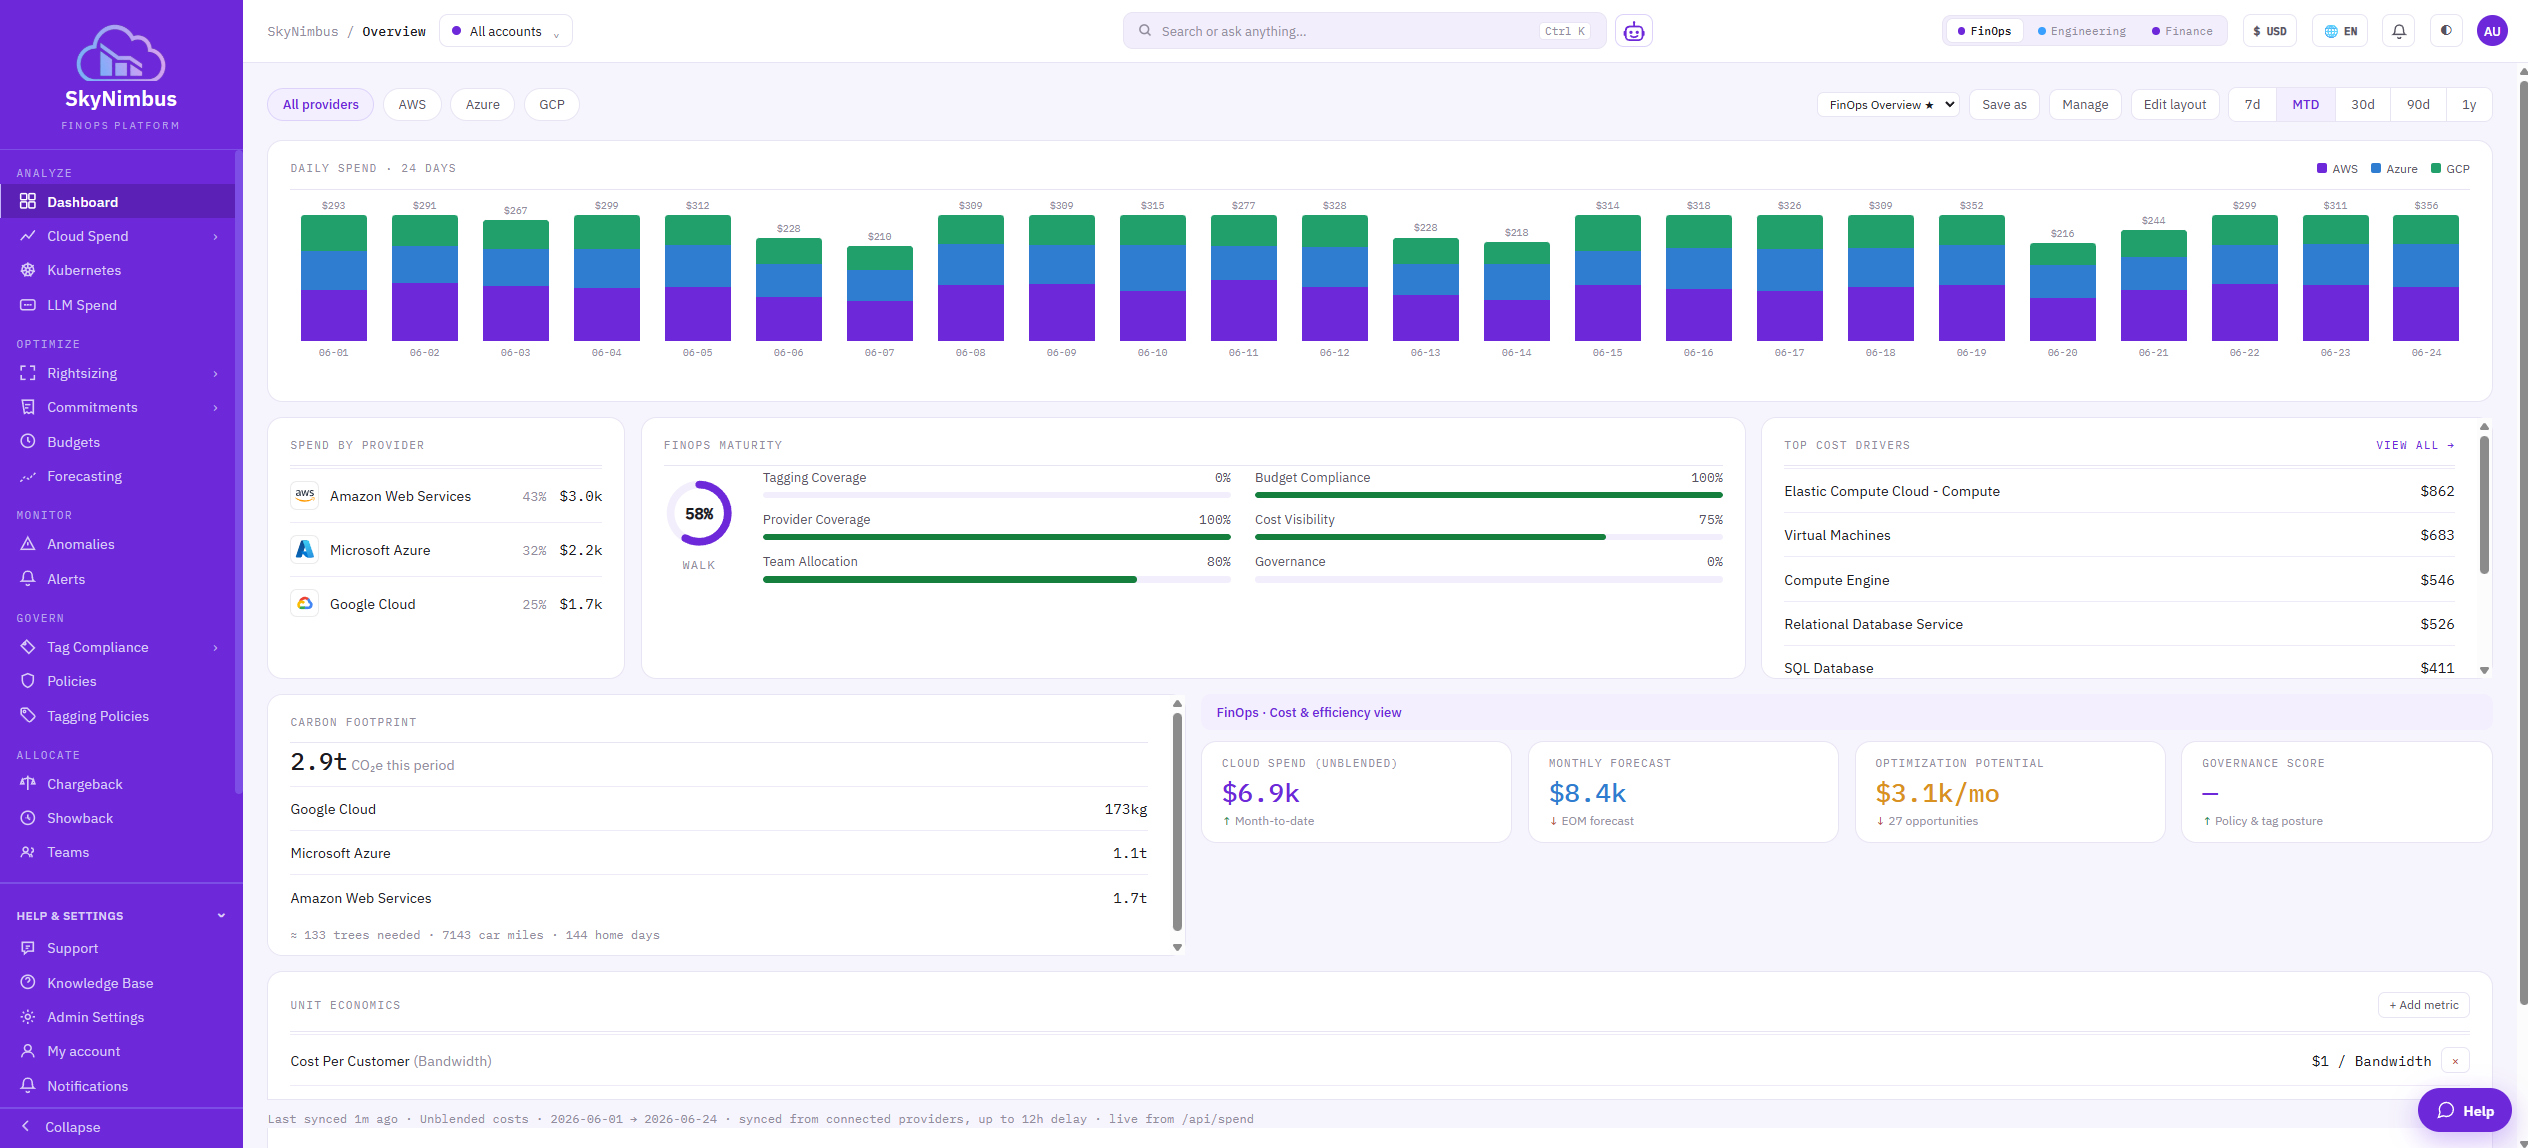
Multi-cloud spend visibility
Connect AWS, Azure, GCP and Oracle Cloud plus custom integrations like Supabase and Pax8. Get a unified view of spend across all providers, services and regions without switching between consoles.
📊
Spend forecasting
See where your cloud bill is heading before the month ends. Adjust headcount, compute and storage assumptions and watch the EOM projection update in real time.
🏷️
Tag governance
Define required tags, enforce allowed values and auto-remediate missing tags. Track coverage across thousands of resources with a single score you can actually act on.
⚡
SkyPilot — AI Savings Engine
Claude-powered commitment recommendations across AWS, Azure, GCP, Oracle Cloud, Supabase and Pax8. Analyzes 90 days of spend patterns to identify Savings Plans, Reserved Instances and CUD opportunities. Ask SkyPilot questions, get per-recommendation AI insights, and generate executive summaries for leadership.
🤖
AI FinOps Assistant
Ask questions about your cloud spend in natural language. The SkyNimbus AI analyzes your real-time cost data, identifies trends, explains anomalies and suggests optimizations. Powered by Claude with full context of your FinOps data.
🏢
On-Prem monitoring
Deploy the Weather Station agent to monitor vSphere and Hyper-V infrastructure. Utilization heatmaps, waste detection, cloud migration cost estimates and rightsizing recommendations for your on-premises VMs.
☸
Kubernetes cost allocation
Break down Kubernetes spend to the namespace and workload level across EKS, AKS, GKE and self-hosted clusters. See cost by pod, label and deployment. Import via CSV or connect the SkyNimbus K8s agent.
🔧
Tag Forge — virtual tagging
Apply virtual tags to spend records without modifying real cloud resources. Build rules like “if service contains RDS, tag as team=data-platform.” Preview matches before committing. View spend grouped by any forged tag key.
💳
SaaS spend tracking
Connect Datadog, GitHub, Stripe, Ramp, Starlink, MetTel and 111 SaaS, telecom & AI products (77 API-enabled). Pull real billing data via API, track seat utilisation and catch renewals well in advance.
📝
Chargeback and showback
Automatically attribute cloud costs to teams and cost centres. Generate invoice-ready chargeback reports with one click in PDF or CSV format.
🔍
Rightsizing
Identify idle and over-provisioned resources across all cloud providers. AWS Cost Explorer rightsizing and Azure Advisor recommendations with waste detection for unattached volumes, unused IPs and stopped instances.
🗑️
Waste detection
Automatically scan for unattached storage, unused IPs, stopped instances and idle resources. See exactly how much you can save by cleaning up cloud waste.
💰
Commitment management
Pull Savings Plan and Reserved Instance data on demand. See coverage, utilisation and purchase recommendations to maximise your commitment discounts.
🌱
Carbon tracking
Measure your cloud carbon footprint with provider-specific emission factors. See CO₂ equivalents and track environmental impact alongside costs.
🏗️
Terraform cost estimation
Upload a Terraform plan and get an instant cost estimate before deploying. Supports 50+ resource types across AWS, Azure, GCP, Oracle Cloud, Supabase and Pax8. CI/CD integration via GitHub Actions.
🔔
Slack and Teams webhooks
Get real-time cost alerts in your team's Slack channels or Microsoft Teams. Automatic notifications for anomalies, budget breaches and sync failures.
🏛️
Architecture cost sandbox
Drag and drop 100+ cloud components onto a canvas with live pricing from the AWS and Azure APIs. Configure instance types, storage and regions in the properties panel.
📈
LLM spend tracking
Track costs across OpenAI, Anthropic, Google and other LLM providers. Monitor cost per model, tokens consumed and cost-per-1M-tokens trends.
📊
Unit economics
Define business metrics like customers, API calls or transactions. See your cost-per-unit to understand the true cost of delivering your product.
🔀
Shared cost splitting
Split shared resources across teams with configurable rules. Even splits, percentage-based or fixed allocations with full audit trail.